Spectragraph analyzer, Spectragraph display, Spectrafoo™ spectrum analysis – Metric Halo Production Bundle User Manual
Page 40
Operation
40
associated band. Mac
⌘ (Command)–click, Windows Control-click or double-click the dot to toggle the band
enable. Mac
⌥ (Option)–click or Windows Alt the dot to adjust the bandwidth (dragging right increases the
bandwidth, left decreases the bandwidth). Mac
⌘⌥ (Command + Option)–click or Windows Control+Alt-
click the dot to switch the band filter type. Click and drag the smaller dots associated with a larger dot to
adjust the filter bandwidth.
To dismiss the filter curve, click anywhere in the black area of the transfer function. This will deselect the filter
point, and the only trace displayed will be the green master curve.
If you right-click (Mac/Win) or Mac
⌃ (Control) click on the transfer function, you will see a menu to set the
vertical dB scale for the display. The values are:
• ±3 dB
• ±6 dB
• ±12 dB
• ±24 dB
• ±36 dB
This menu also allows you to specify whether adjusting a filter causes it to automatically be enabled. This
preference is for all instances of ChannelStrip 3.
Spectragraph Analyzer
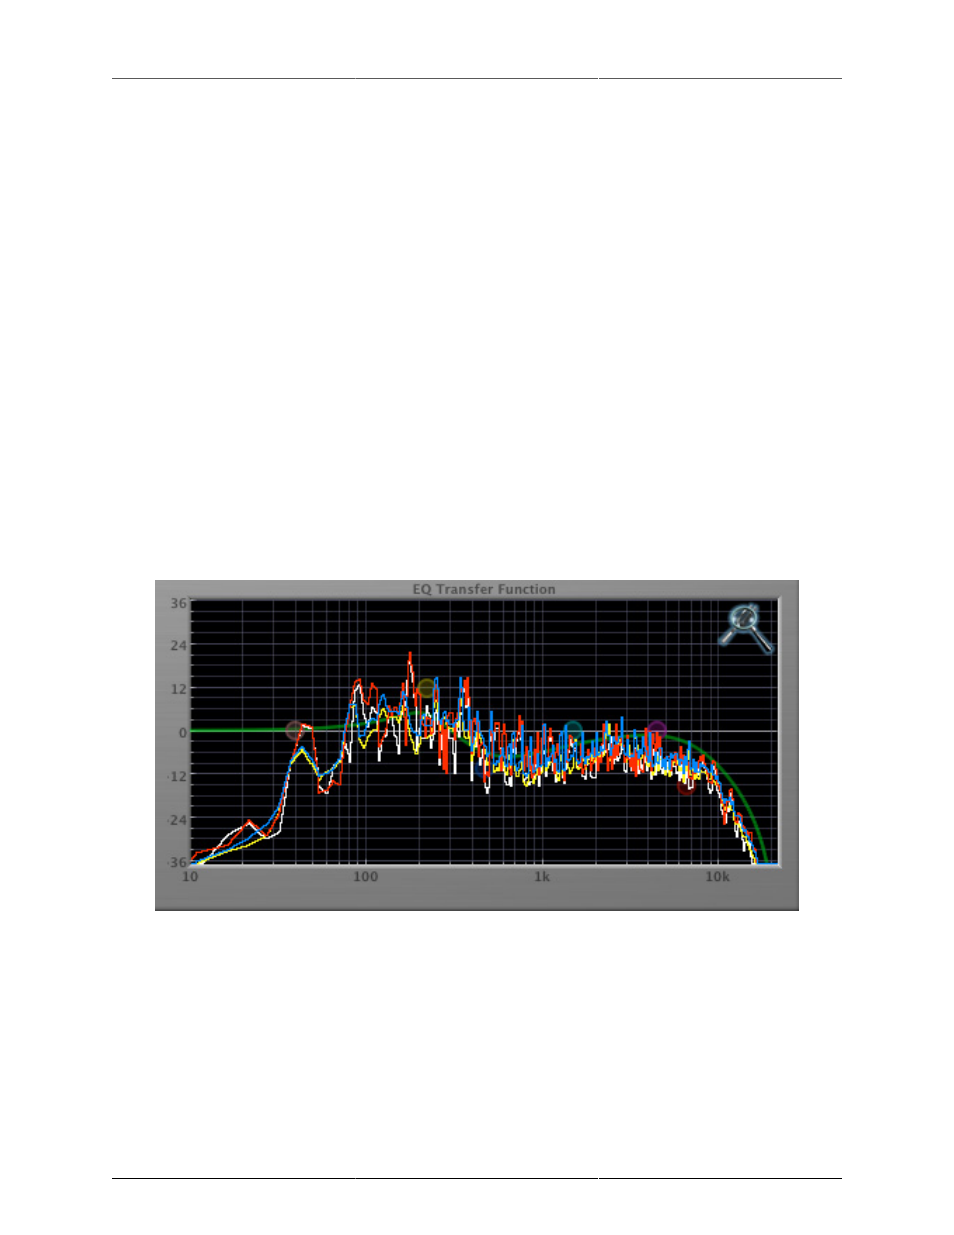
Clicking the SpectraFoo™ logo in the upper right hand corner of the transfer function will activate the spec-
tragraph, showing the realtime frequency analysis of your signal:
Figure 8.25: Spectragraph Display
The traces are:
• White: Left channel instantaneous display
• Red: Right channel instantaneous display
• Yellow: Left channel average display
• Blue: Right channel average display
The instantaneous trace updates in real-time, allowing you to see the immediate peak level of your audio. The
average trace displays the level as averaged over a short period, giving you a more general view.