Measurement Computing eZ-TOMAS rev.11.0 User Manual
Page 54
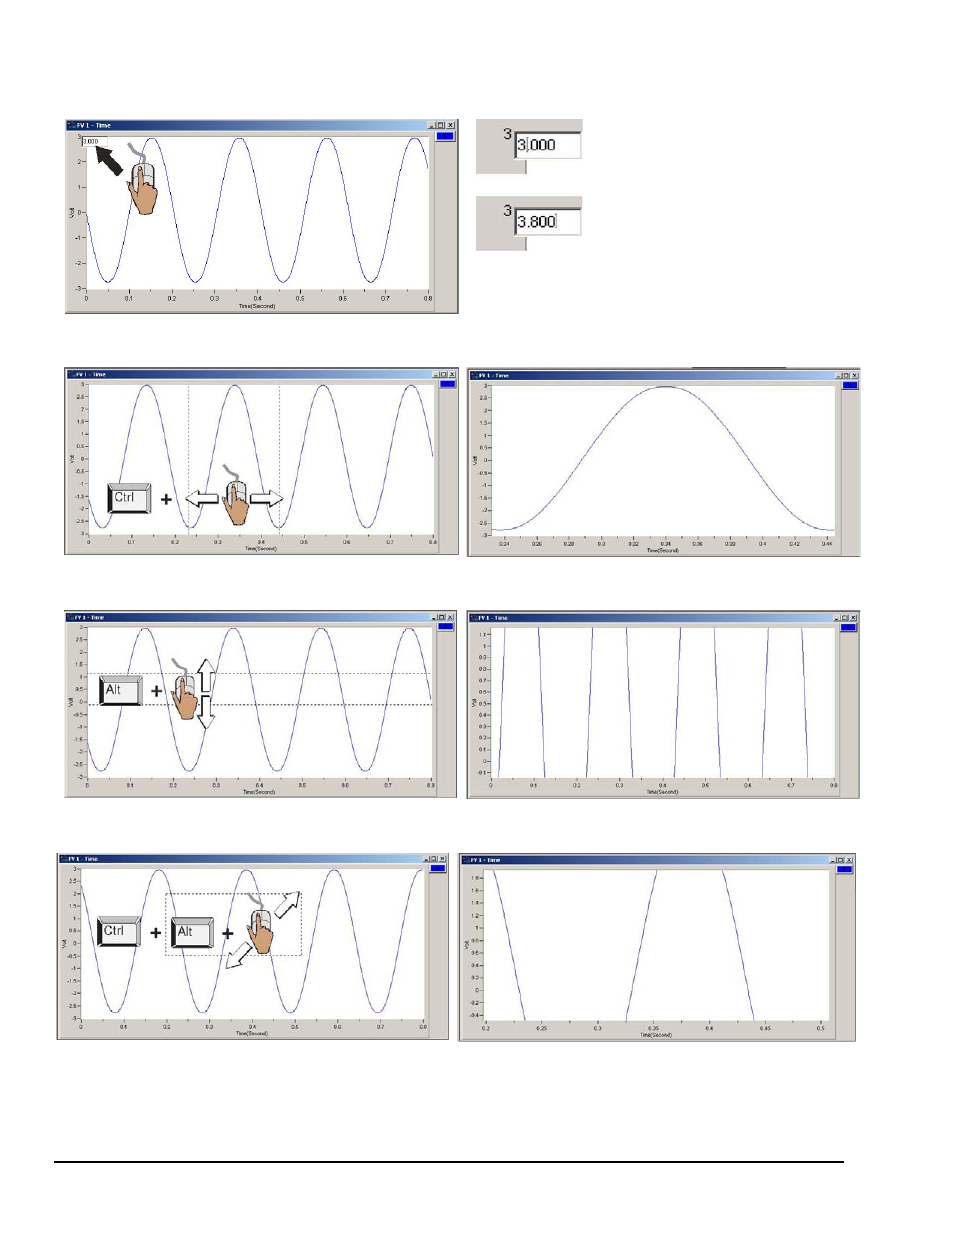
Changing Display Ranges and ScalesTo change the maximum or minimum range value (following figure): Left-click on
upper or lower scale value that is to be changed, then enter the new value. An example follows. This technique works for
both X and Y axis.
In this example, the cursor and PC
keyboard were used to change the
maximum scale value from 3.000 volts
to 3.800 volts.
To change the X-Axis (following figures): Hold down the <Ctrl> key, at the same time, left-click and drag the mouse
cursor horizontally on the plot. Two vertical cursor lines will define the new x-axis end points.
To change the Y-Axis (following figures): Hold down the <Alt> key, at the same time, left-click and drag the mouse
cursor vertically on the plot. Two horizontal cursor lines will define the new Y-axis end-points.
To simultaneously change the X & Y Axes (following figures): Hold down the <Ctrl> and <Alt> keys, at the same time,
left-click and drag the mouse cursor diagonally on the plot. A rectangle will define the new area of the plot.
5-4 Display Menu … Plots
947294
eZ-TOMAS