Measurement Computing eZ-TOMAS rev.11.0 User Manual
Page 8
A Look at the Gauge Window & Control Pull-down Menu
The Gauge Display Window is used to show real-time values and measurement status. Gauge Display is
not used for historical data analysis. A Data Display Window, discussed elsewhere, is used to analyze real-
time and historical data.
The Gauge Display Window’s Control pull-down menu repeats the functions of the Gauge window’s lower
panels. For example, menu selections can be used in place of several Option panel buttons, as well as the
toggle switches and snapshot button. The menu provides a means of displaying high and low peak values,
gauge values, a machine image, and a list of eZ-TOMAS projects. The menu and its functions are depicted
on the Gauge window figure on the following page.
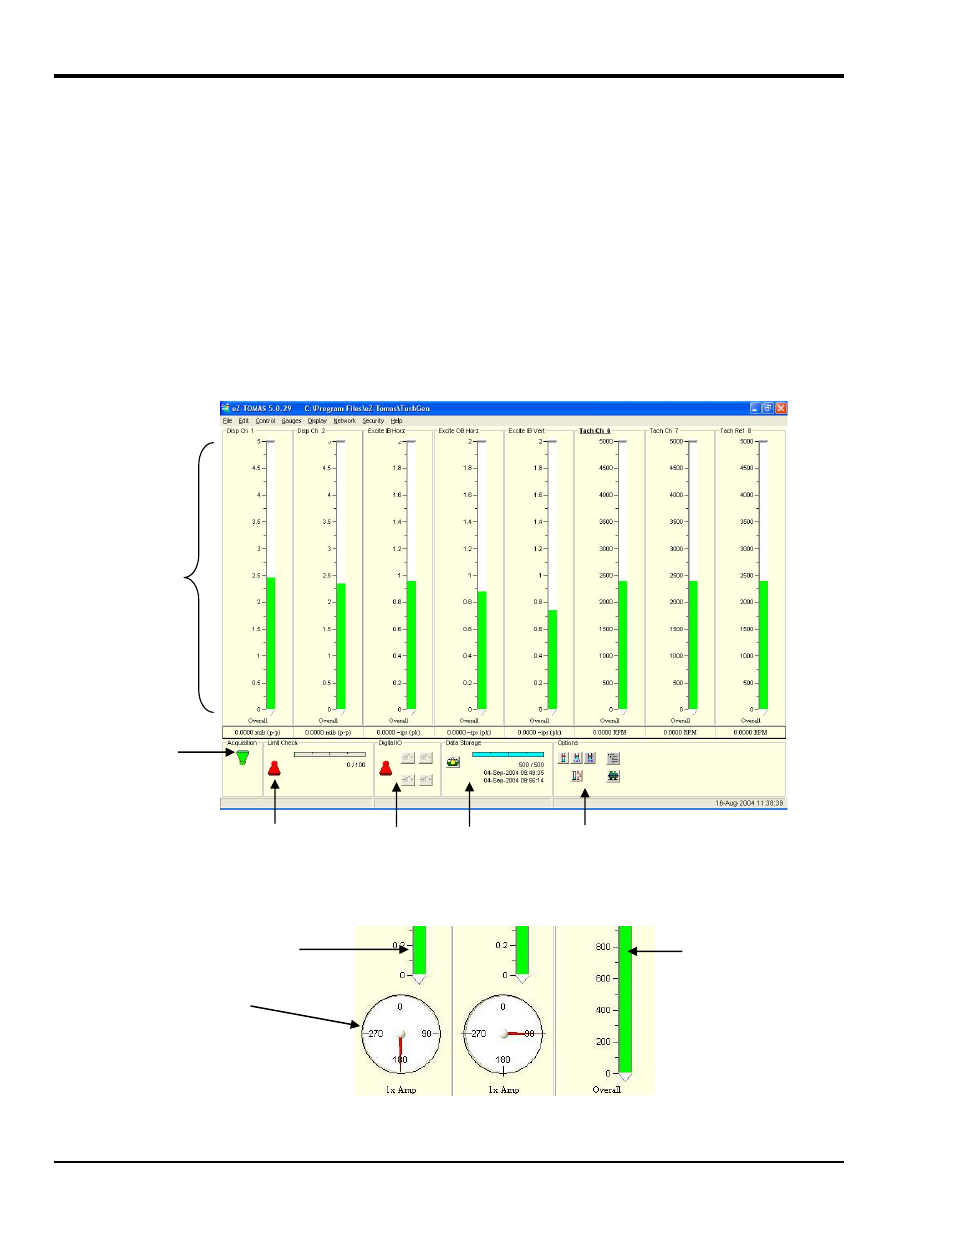
The main window of the GUI (graphical user interface) includes a set of virtual gauges, which use one of
10 spectral bands, discussed shortly. There will always be a vertical gauge associated with each input
channel. When the 1x Amp/Phase selection is made, spectral bands for “1x Amplitude” and “1x Phase” are
simultaneously displayed, with the later being in a circular phase gauge (see second figure).
In addition to spectral band gauge displays, eZ-TOMAS can interactively display data in a variety of other
formats, including: Orbit, Polar, Time, Bode, Cascade/Waterfall, Strip Chart, and Shaft Centerline.
Instrument
(Gauge) Panel
Acquisition
Panel
Limit Check Digital I/O Data Storage Options
Gauge Window, “Overall” Spectrum Selected
Vertical Gauge for
1x Amp
Circular Phase
Gauge
Vertical Gauge
Tach Ref (RPM)
Shown for reference.
Vertical Gauges (partial) and Circular Phase Gauges
1-4 Introduction
987294
eZ-TOMAS