Measurement Computing eZ-TOMAS rev.11.0 User Manual
Page 83
The preceding report was generated using the settings from the XL Report dialog box. The report contains
Channel's 1 and 2, the HiHi Limit values assigned to each Spectral Band in each RPM range, the
Maximum Spectral Band value obtained in each of the selected RPM ranges, and the Maximum Spectral
Band value obtained outside any of the selected RPM ranges (the Out of Ranges value).
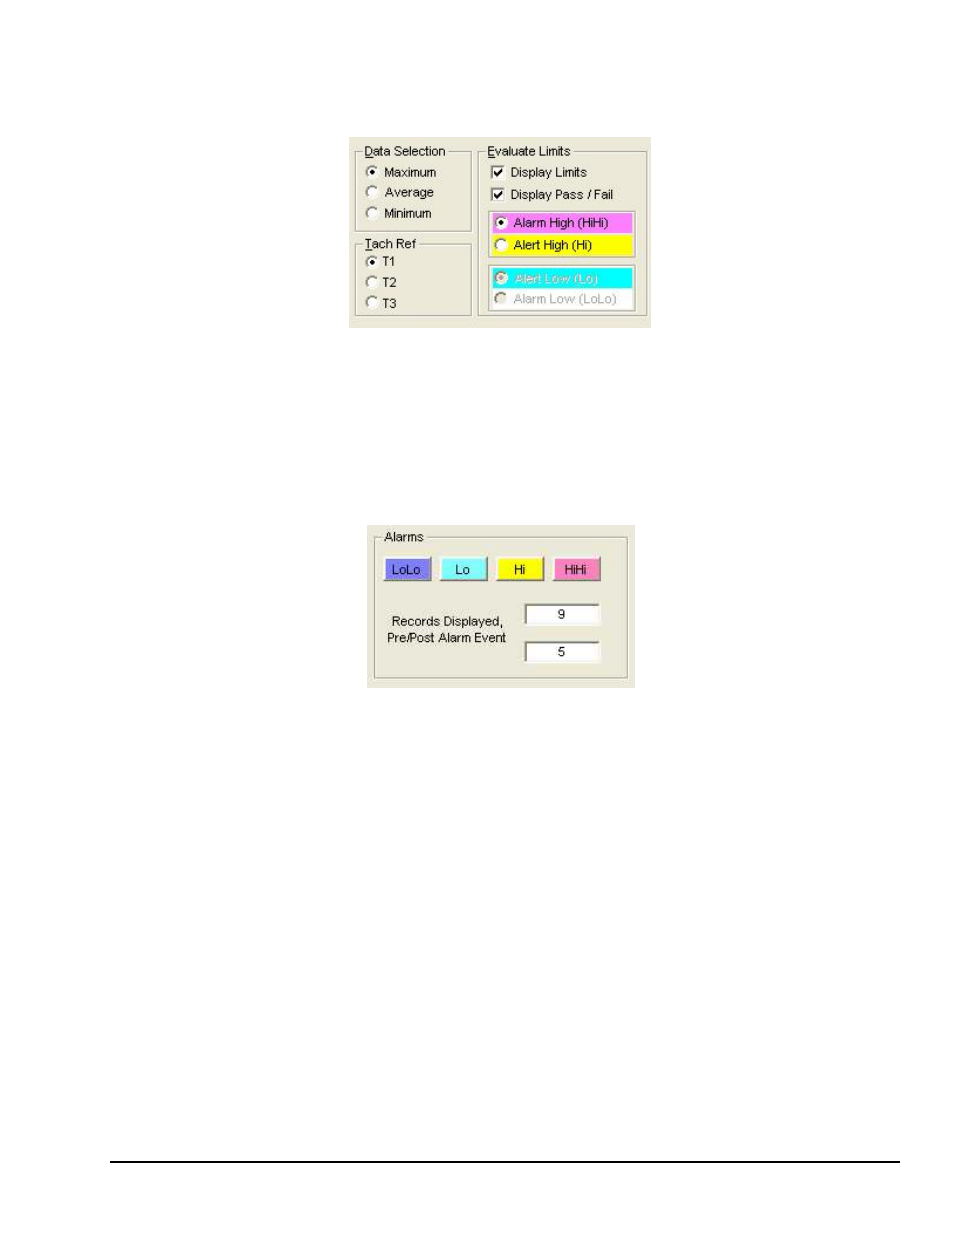
Data and Limits selection
The Report contains the HiHi limit values from the Spectral Band RPM range limits set, because the HiHi
limits were selected in the Report options. When the Data Selection is set to Maximum, you have your
choice of either the HiHi or Hi limits. When set to Minimum, you can choose between the Lo or LoLo
limits. If Average is selected, two limits will be included in the report. One will be either HiHi or Hi, the
other either Lo or LoLo.
The colors displayed in the Evaluate Limits section of the XL Report dialog box, reflect the colors of the
limits as they are defined in the Display Preferences window.
Alarms Colors [in the Display Preferences Window]
When deciding what options will be selected for the report, if the Display Pass/Fail option is enabled,
eZ-TOMAS will perform an analysis of the data and include the results in the Excel Report.
eZ-TOMAS
947494
Display Menu …. Reports 8-11